Utility & Energy Management
Smart metering, per-unit consumption tracking, automated cost allocation, sustainability reporting, anomaly detection, and energy efficiency insights -- all from one dashboard.
CHALLENGE
Utility Costs Are a Black Box
Unfair Cost Splitting
Dividing utility bills equally penalizes frugal residents and subsidizes waste. No per-unit data means no fair allocation.
No Consumption Visibility
You cannot manage what you cannot measure. Without smart metering, energy waste runs unchecked across your portfolio.
Manual Billing Headaches
Staff spend hours reading meters, calculating splits, and manually adding utility charges to invoices. Errors are constant.
Leak & Waste Detection Gaps
Water leaks and HVAC faults go undetected for weeks. By the time you notice, the damage and cost are significant.
No Sustainability Data
Investors and regulators increasingly demand ESG reporting. Without consumption data, you cannot report or improve.
Resident Disputes
Residents challenge utility charges because they have no visibility into their own consumption. Every bill cycle triggers complaints.
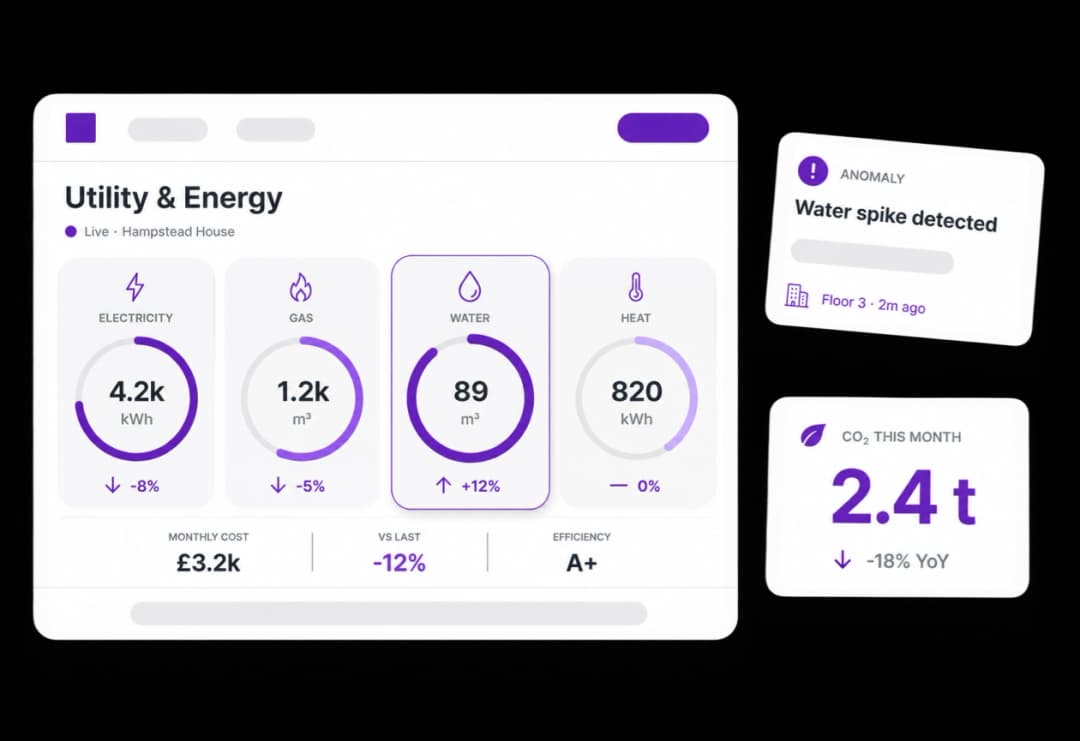
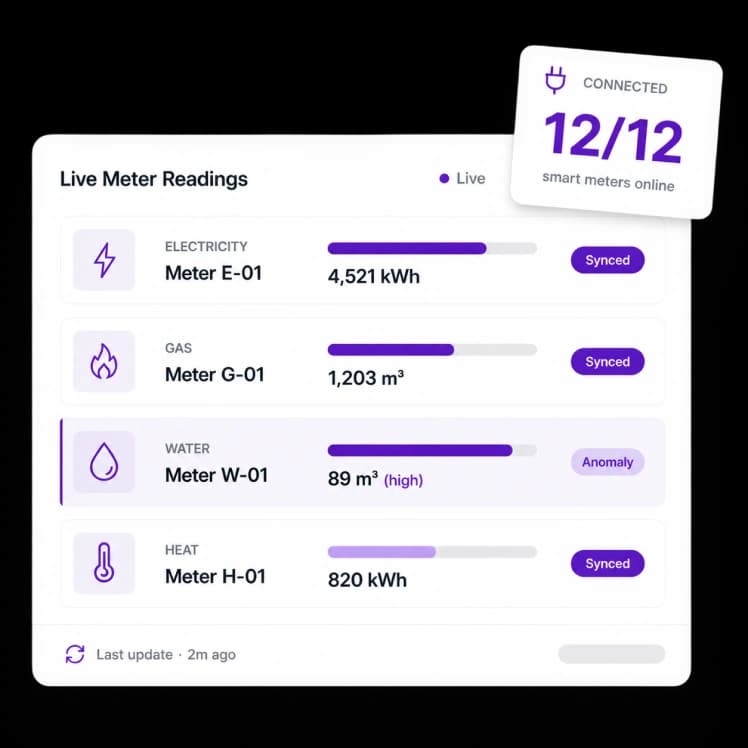
Smart Meter Integration & Data Collection
Connect to smart electricity, gas, water, and heat meters across your portfolio. Automatic readings every 15 minutes. No manual meter reads ever again.
Integration with major smart meter providers: Chameleon, Hildebrand, Stark, and utility company APIs
Automatic 15-minute interval readings for electricity, gas, water, and heat meters
Sub-metering support: individual room meters, floor meters, and common area meters
Automatic meter registration on move-in and deregistration on move-out
Historical data import for pre-existing meters and manual reading fallback
Real-time meter health monitoring with alerts for offline or malfunctioning devices
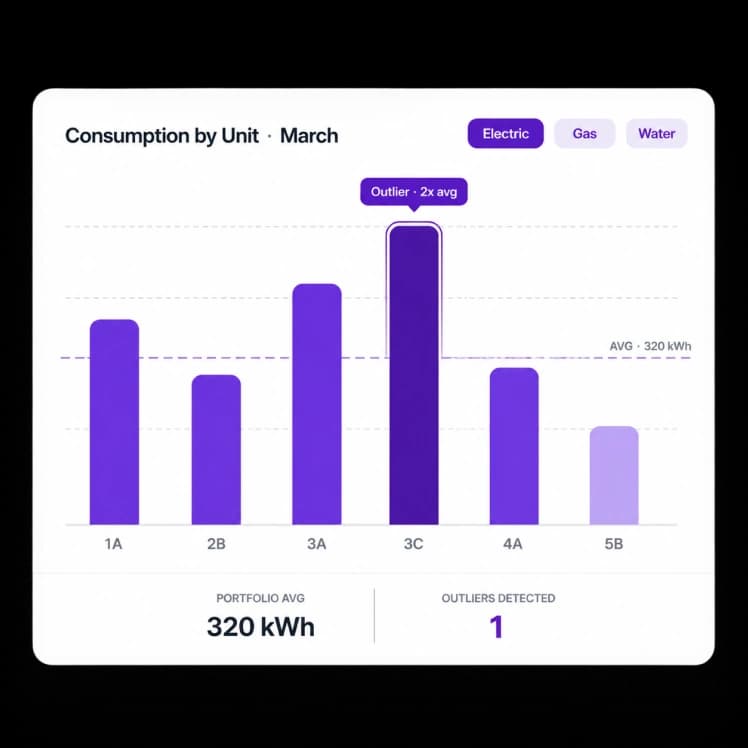
Per-Unit Consumption Tracking & Dashboards
See exactly how much energy each unit, floor, and common area consumes. Compare properties, identify outliers, and track trends over time.
Per-room and per-bed consumption dashboards with daily, weekly, and monthly views
Property-level and portfolio-level energy overview with drill-down capability
Consumption heatmaps showing peak usage times and high-consumption units
Year-over-year comparison: track improvement or degradation by property and unit
Benchmarking: compare unit consumption against property averages and portfolio norms
Automated outlier detection: flag units consuming 2x+ above the property average
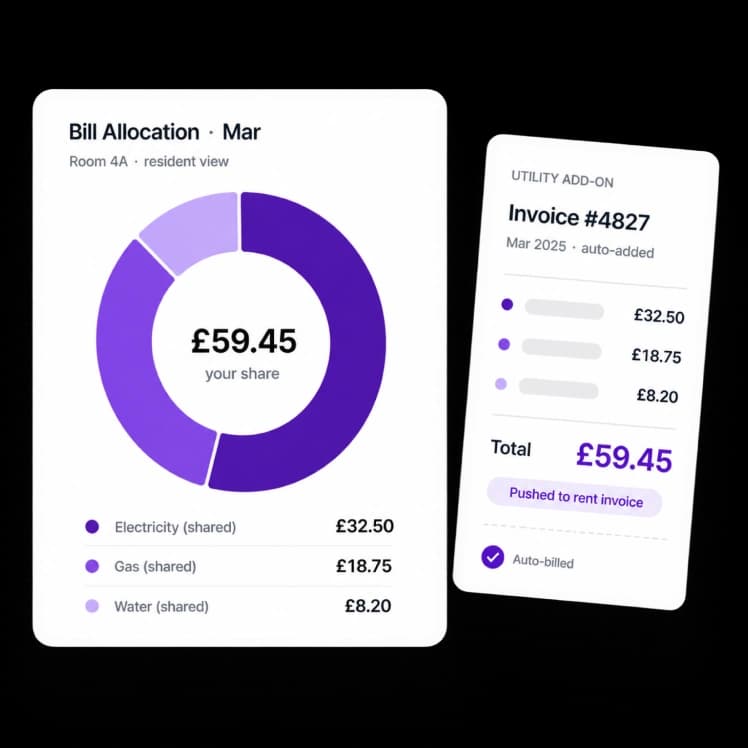
Automated Cost Allocation & Billing
Calculate and allocate utility costs automatically using configurable rules. Per-meter billing, proportional splitting, capped allowances, or included-in-rent models -- you choose.
Configurable billing models per property: metered, proportional, capped, or all-inclusive
Automatic cost calculation using tariff rates, standing charges, and consumption data
Fair splitting for shared spaces: common area costs allocated proportionally by occupancy
Capped utility allowances: residents get a free allowance, pay only for excess usage
Automatic charge generation pushed to the Payments module for invoicing
Multi-tariff support: day/night rates, seasonal pricing, and renewable energy credits
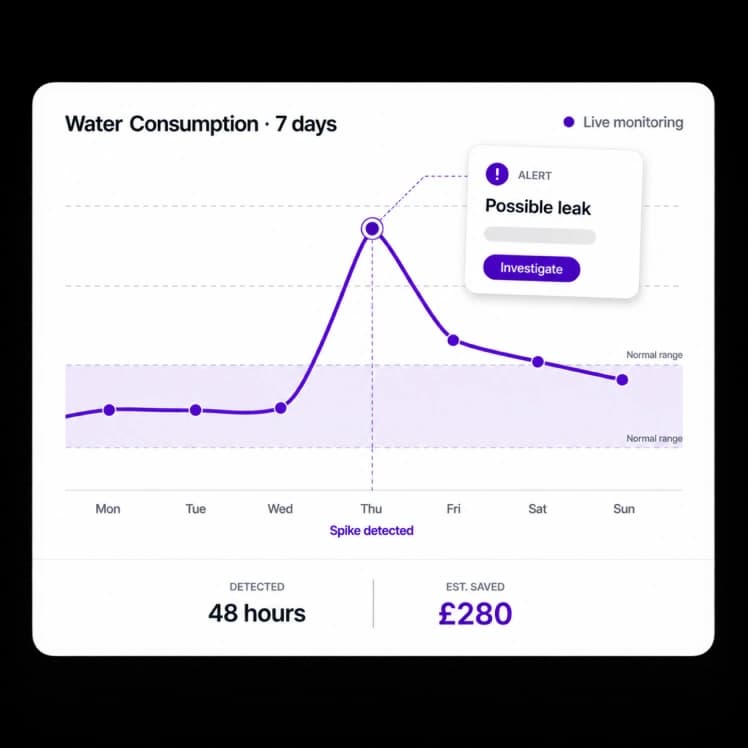
Anomaly Detection & Leak Alerts
AI-powered monitoring catches unusual consumption patterns before they become costly. Water leaks, HVAC faults, and energy waste detected and flagged automatically.
Continuous monitoring algorithms comparing real-time usage against historical baselines
Water leak detection: sudden or sustained consumption spikes trigger instant alerts
HVAC anomaly detection: heating or cooling running when units are unoccupied
Electrical fault indicators: unusual power draw patterns flagged for investigation
Configurable alert thresholds and escalation rules per property and meter type
Estimated savings dashboard: see how much anomaly detection has saved you
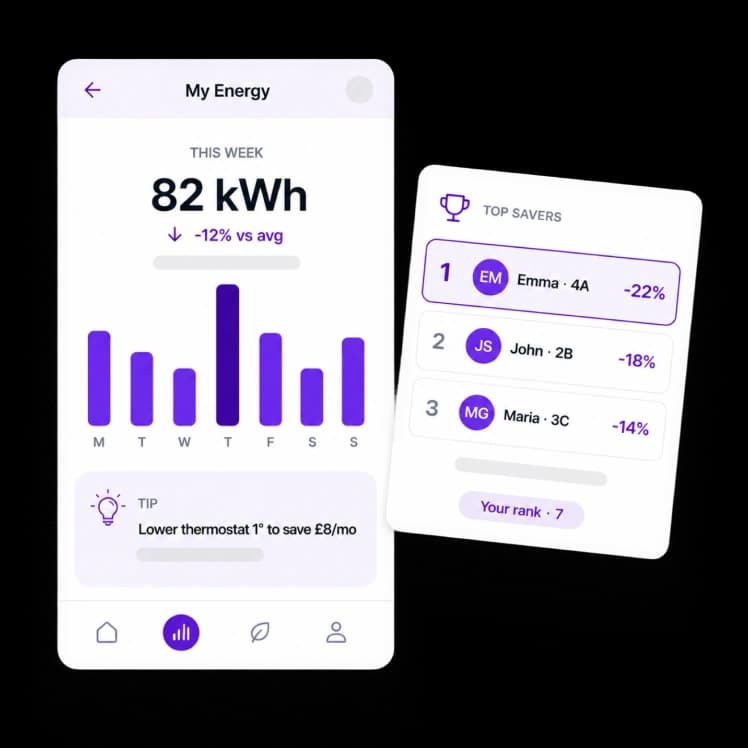
Resident Energy Portal & Transparency
Give residents visibility into their own consumption. Self-service dashboards, usage tips, and transparent billing eliminate disputes and encourage conservation.
Resident-facing consumption dashboard in the tenant portal and mobile app
Daily and weekly usage summaries with comparison to property averages
Personalized energy-saving tips based on consumption patterns and property type
Billing transparency: residents see exactly how their utility charges are calculated
Push notifications for unusual usage: helps residents catch issues in their own units
Gamification option: energy-saving challenges and leaderboards between units
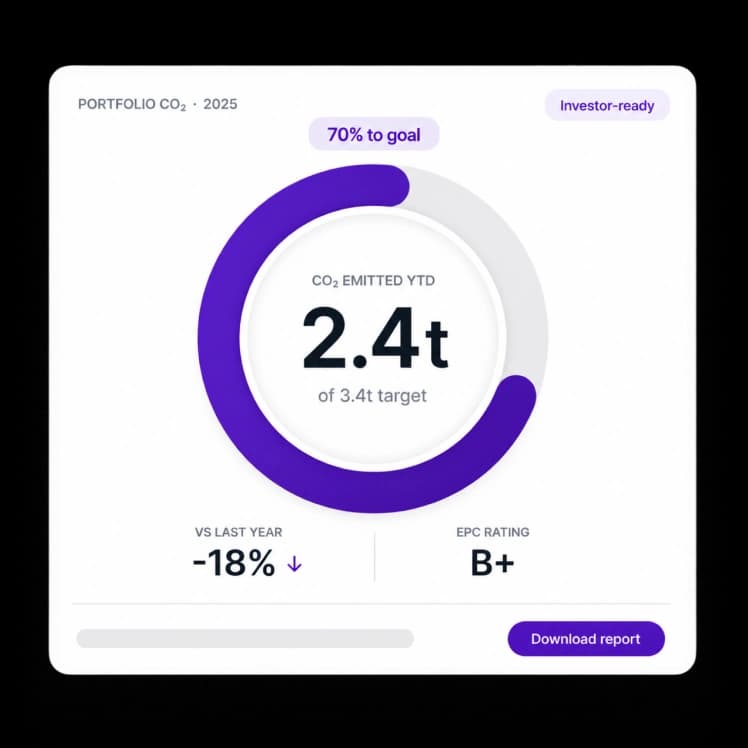
Sustainability Reporting & ESG Compliance
Generate carbon footprint reports, track energy efficiency improvements, and meet investor ESG requirements with automated sustainability dashboards.
Carbon footprint calculation: CO2 equivalent reporting per property, portfolio, and per-bed
Energy Performance Certificate (EPC) tracking and improvement planning
Renewable energy tracking: solar panel generation vs. grid consumption
ESG report generation: investor-ready sustainability reports with year-over-year trends
Regulatory compliance: automated reporting for MEES, EPBD, and local energy regulations
Sustainability goals dashboard: set targets and track progress across your portfolio
Take Control of Utility Costs
See how smart metering and automated billing eliminate disputes, cut energy waste, and give you full visibility into every kilowatt.
23%
Average energy cost reduction with smart monitoring
100%
Elimination of manual meter reading
0
Utility billing disputes with transparent dashboards
48h
Average time to detect water leaks vs. weeks manually
CLIENT WORDS
26 battle-tested modules covering the full resident lifecycle, from first application to move-out and beyond.
We were losing thousands monthly to undetected water leaks and unfair utility splits that drove resident complaints. Within 3 months of deploying the energy module, we cut utility costs 23%, eliminated billing disputes entirely, and caught two major leaks within hours instead of weeks.
Finance Director
UK Coliving Operator, 22 properties, 1,800 beds
EXPLORE MORE
Works With These Capabilities

Compliance & Regulatory Management
Certificate tracking, renewal alerts, document serving, right-to-rent verification, and audit-ready reporting.

Document Management & Digital Contracts
Contract templates, e-signatures, secure storage, automated serving, acknowledgment tracking, and audit trails.

Lead & CRM Management
Multi-channel lead capture, AI scoring, pipeline management, nurturing sequences, and marketing attribution.
FAQ
Frequently Asked Questions
We integrate with all major smart meter infrastructure providers and utility company APIs. For sub-metering, we support Chameleon, Hildebrand, Stark, and most Zigbee/MQTT-based meters. Our API also supports custom hardware.
Yes. Each property can have its own billing model: fully metered, proportional split, capped allowance, or all-inclusive. You can even mix models within a property for different utility types.
Our algorithms compare real-time consumption against historical baselines. A sudden spike (burst pipe) or sustained above-normal usage (slow leak) triggers alerts within hours. You configure the sensitivity and escalation rules.
Yes. Residents access their energy dashboard from the tenant portal and mobile app. They see daily usage, comparison to averages, how charges are calculated, and personalized saving tips.
Carbon footprint per property and portfolio, EPC tracking, renewable vs. grid consumption, ESG investor reports, and regulatory compliance reports for MEES and EPBD. All exportable as PDF or CSV.
Most operators see 15-25% energy cost reduction within 3 months through leak detection, waste identification, and behavioral change from resident transparency. The module typically pays for itself within the first quarter.
Ready to Cut Energy Waste and Bill Fairly?
Book a demo and see how smart utility management reduces costs, eliminates disputes, and meets your sustainability goals.